
Knights Province - Alpha 12
How does one fix AI starvation?
Knights Province AI opponents in Skirmish have a known occasional issue of not producing enough food for their servants, resulting in citizen starvation and early collapse of their town economy due to that. Let’s look into what it takes to fix that issue!
What is it so bad about unit starvation in the game anyway? Well, a number of things:
- First and foremost (all others stem from it) is that units dying of hunger is a planned penalty from the game for poor town management. Hence all the points below are more or less intended to be working together to implement that penalty.
- Units die of starvation and need to be replaced by hiring new ones, which is free for serf/builders, but costs gold for skilled professions. In both cases, re-hiring takes additional time.
- Units waste time by going to Tavern frequently and back instead of working
- Hungry serfs may die while carrying wares, which not only wastes the ware, but also means that a new delivery will need to start from scratch.
- Hungry builders may die while performing roadworks, effectively canceling them. New roadworks will need to be issued.
- Hungry units create traffic jams on their way to and around the Taverns, further taxing the economy
- This just looks bad
The first thing to do before we dive into tweaking and refactoring, is to define in simple and measurable terms “What is starvation and collapse of the economy? How can it be quantified?”. So that we could run a game for some period of time and conclude if the AI player starved or not and possibly measure to what extent. Not all measurements could be reliable though - for example, having little food in stock does not necessarily mean that it’s in shortage, since we can easily rationalize that in an efficient economy there are no ware surpluses - everything gets made to be used. More reliable metric might be counting unit deaths from starvation. This is not as straightforward too, since e.g. Builders can die of hunger while waiting for stone when building roads, no matter how much food there is - meaning that some number of deaths may occur due to other reasons (e.g. stone shortages). This also requires the game to run for at least an hour (so that at least half of the newly trained units get enough time to get hungry). Another metric - total Gross Domestic Product (GDP) (how many wares were made in the town during the game). When the town economy is down, GDP should be down as well. And finally (at least for now) is Army Power - how many warriors were trained. This is an indicator of a well-running economy too - since lacking in food production could seriously handicap military power as a result.
In the end, I chose to look at all of these metrics - (town GDP, ArmyPower, food reserve and starved units).
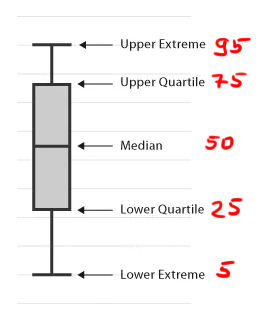
Next thing - we need to measure and display the metrics in a digestible form. For that there’s the good old Runner/Stadium tool - it runs batches of games in headless mode in many threads and collects and displays resulting data from them. Due to the nature of the game, resulting values have a large degree of random jitter in them. However, with large data sets, those irregularities get averaged out and we end up with more or less normally distributed sets of values. Box plot chart is a good starting point for representation of such measurement. It shows 5 percentile values, which I chose to be: 5, 25, 50, 75, 95. So that we can ignore the few random outliers and look at the bulk.
Unfortunately Delphi has no modern and easily-available charting library, so I had to either resort to a limiting text display or to process the data and export it into an external viewer. Highcharts.js is one of such external “viewers”, it looks nice, works “out-of-the-box” and I have successfully used it in the past. The main problem with it is that Highcharts is a JavaScript library. In prior uses I was creating JSFiddle templates and copy-pasted data into it by hand. Now I wanted to optimize that out. Since the stock Delphi WebBrowser component didn’t want to display Highcharts, and I had a prejudice towards Chrome, I decided to jump at the possibility and went ahead to embed the Chromium frame inside the Stadium. Now it was a matter of getting a boxplot template and stuffing it with data - a trivial task. The template gets filled and displayed in the Stadium’s UI automatically. This also allows for easy template swapping (to e.g. another kind of chart or other JS modules).
With the display sorted out - let’s get back to saving AI players from occasional starvation!
One more thing - you may ask, why don't we just cheat it away? Like giving AI tons of food or disabling hunger for it altogether. Well, Knights Province is a kind of game with attention to detail already. It would not look good to have AI towns be “all smoke and mirrors”. Another concern is that cheating robs us of the chance to learn and to understand and fix the core issue. Layers of cheats also make the development problematic in the future, where they might become so entangled that we can not simply do anything else but try to blindly cheat more and more.
Our first stab will be at AI foreplanning. Perhaps AI starts to build the food economy too late? Let’s try increasing the value of grain production lag - a parameter that says how long it takes between building a farm and getting first grain from it. After all, grain is the main basis of the reliable food production in the game. The value was set suspiciously low (5min), whereas empirical measurements showed it to be closer to 15min. So let’s try running simulations with increased value and see if they show any meaningful difference.
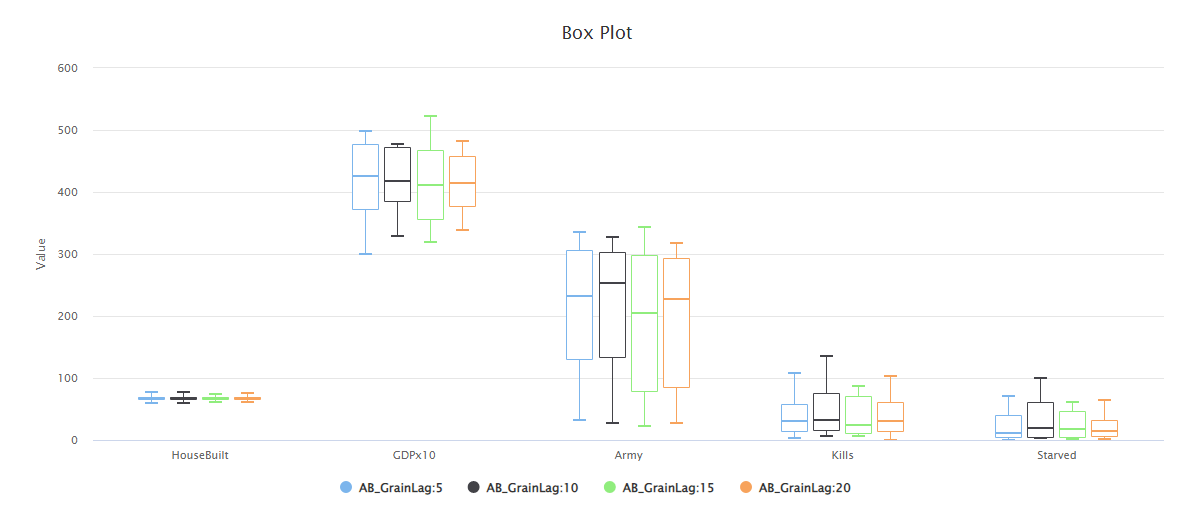
This and following charts are screenshots from the Stadium (mentioned above) whose main focus was on measuring the effects of tweaks in batch runs. Due to that, they are more technical than art and aren’t very readable unless viewed at 100%. Simulations were run between 4 skirmish AIs on a skirmish map for 120min (albeit not as many times as in runs below, hence taller boxes). Displayed groups are - Houses built by AI, Total produced wares value (GDP), Army size in units, Enemy kills, Number of units starved to death. Sections are for grain lag values (AB_GrainLag).
We can see that mean values (averages) and boxes are more or less similar. They don’t show a trend we would expect (higher lag => less starvation) and the means are well within their own and neighbour boxes (25th-75th percentiles) - meaning that the values are quite varied and means themselves are not very reliable - hence we can conclude that the effect of the change is likely quite insignificant.
The second attempt was increasing the AI’s food demand calculation’s results. If citizens die because of too little food being available, certainly there’s a possibility of a flawed estimation of the amount of the food needed, resulting in too few food-production houses being planned and built and food being made. Running new tests with increased coefficients showed very good correlation and effect between increasing food demand and reduction in starvation to death.
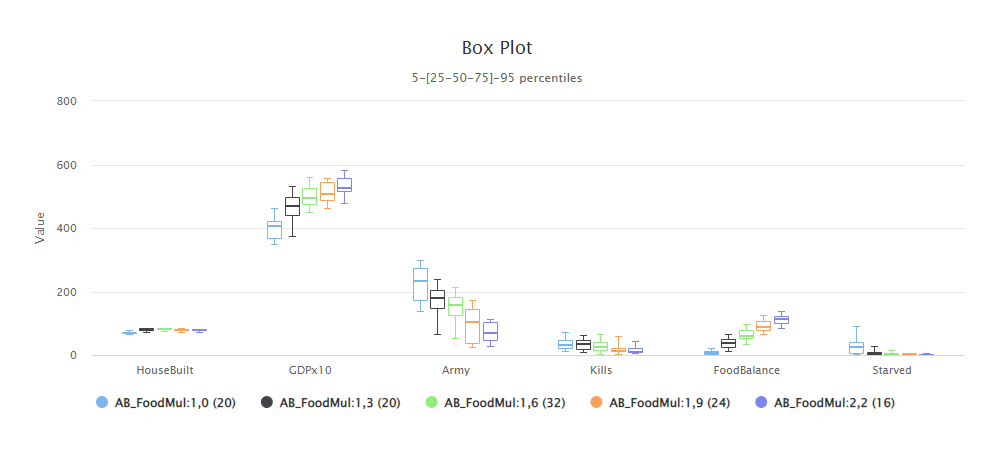
Simulations were run between 4 skirmish AIs on a skirmish map for 120 minutes. Displayed groups are - Houses built by AI, Total produced wares value (GDP), Army size in units, Registered enemy kills, Food reserve at the end of run, Number of units starved to death. Sections are for food demand multipliers (AB_FoodMul).
We can see that with additional food demand multiplication (by 1.3, 1.6, 1.9, 2.2) starvation goes down (food balance increases, starved count goes down). But going past 1.3 starts to affect the army count by a lot, while not giving much of a positive effect in starvation numbers.
It would be easy now to slap a 1.3 multiplier as a patch, but out of search for knowledge and experience, we might want to go deeper and figure out why the calculation was flawed in the first place.
Old calculation took units full condition (2400 seconds of life) and divided it by empirically measured units overeat (115%) with added 30% as a safety bonus on top of that. This formula was written a long time ago when everything was just simpler. It worked good enough for some time - the AI still built a town and trained an army.
In the code the calculation was “1 / (2400 / (1.15 + 0.3)) / 60” food per minute per citizen.
Now let’s rethink the rationale behind these food demand estimates and add some important details:
- A typical citizen has full condition at 2400 and goes to eat when he’s at 300
- Let's say by the time he arrives at the Tavern he's at 240
- This means, typical eating cycle is 2160 seconds
- According to the Tavern algorithm, a citizen will eat till he's at least 90% full and at most - 89% + 60% - 150% (60% being the most nutritious food - sausage)
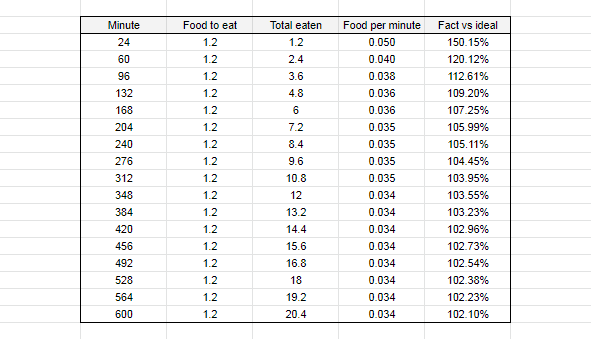
- That said, now we can assume that typically a unit can eat 120% food servings each 2160 ticks (36min)
- This is not all, however. All units start with 60% condition and this means, they will want to eat earlier the first time.
- Throwing the above numbers into a table allows us to see that, for example, at the end of the first hour (24min+36min) a unit will need 2 full servings (240% food) instead of 1.66 servings (200% food). This is 20% higher (0,04 food per minute) than expected if we compare to e.g. the 10th hour (0.033 food per minute, when the effect wears out).
- This effect wears out over time, but since a typical mission is just 1-2 hours, we do need to account for that initial food demand too.
And here’s a comparison between old and new food demand calculations and results:
- resulting old value was 1 / (2400 / (1.15 + 0.3)) / 60 = 1 / 1655 / 60 = 0.036 (servings of food per minute per citizen)
- resulting new value is 1 / (2160 / (1.2 * 1.25)) / 60 = 1 / 1440 / 60 = 0.042 (servings of food per minute per citizen)
This result goes in line with our tests above - new food demand should be at least 17% higher.
Now we can run simulations to see how this works and check if it needs any additional safety bonuses.
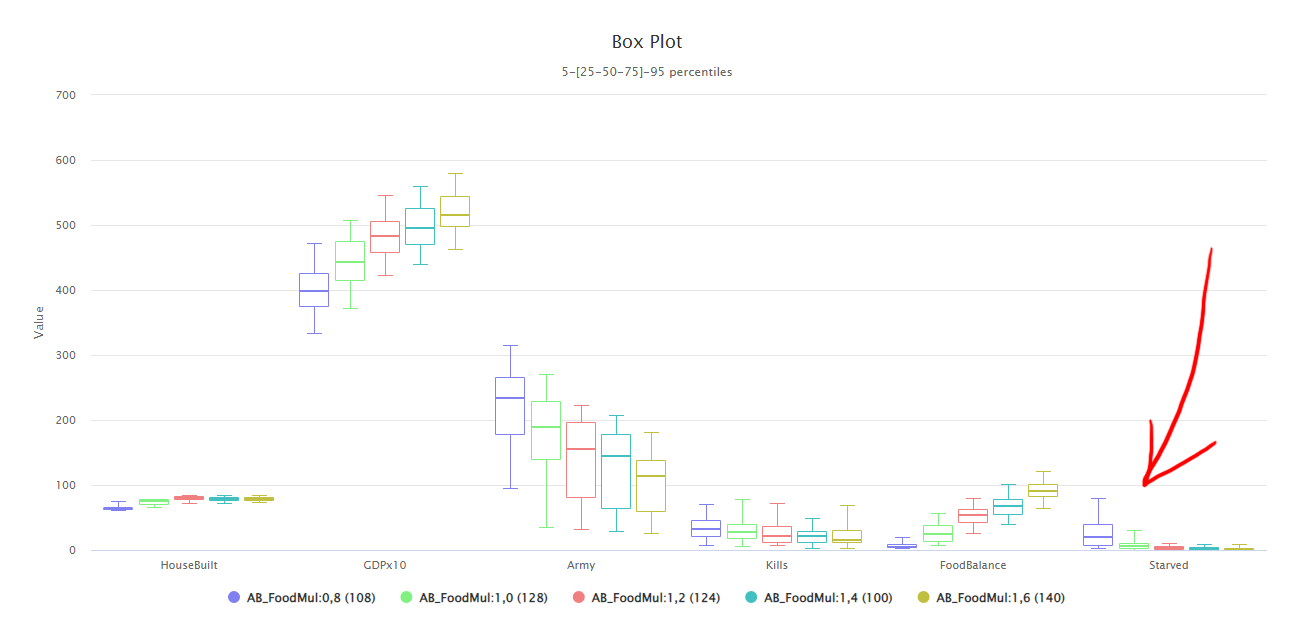
Simulations were run between 4 skirmish AIs on a skirmish map for 120 minutes. Displayed groups are - Houses built by AI, Total produced wares value (GDP), Army size in units, Registered enemy kills, Food reserve at the end of run, Number of units starved to death. Sections are for food demand multipliers (AB_FoodMul).
As we can see, starvation went down by a lot with new food demand calculation. For comparison we also have something close to our old value (0,036 / 0,042 ~= 0.8) - it reliably brings the starvation up again. We can also see how adding additional bonuses past 0.2 will not improve anything, but quite the opposite - reduce the army output and just boost already slightly excessive food reserves. With that result it looks like we can add a small 0.1 bonus for good measure and call it a day.
This was just one of the many small and big AI issues. With improved tools and discipline, now it is more clear on how to approach and solve them.
Bonus, while writing the article I have sped up the simulation by about 40% and have changed the display to error bars that show 95% confidence intervals (since results are quite normally-distributed).
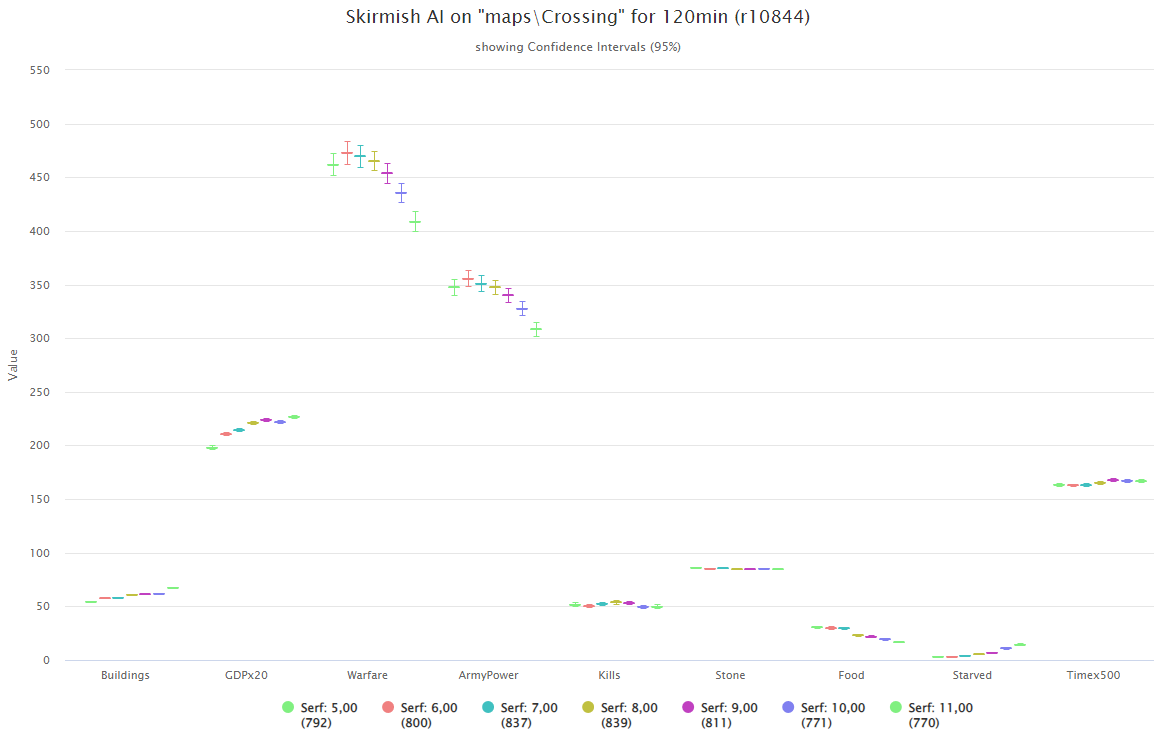
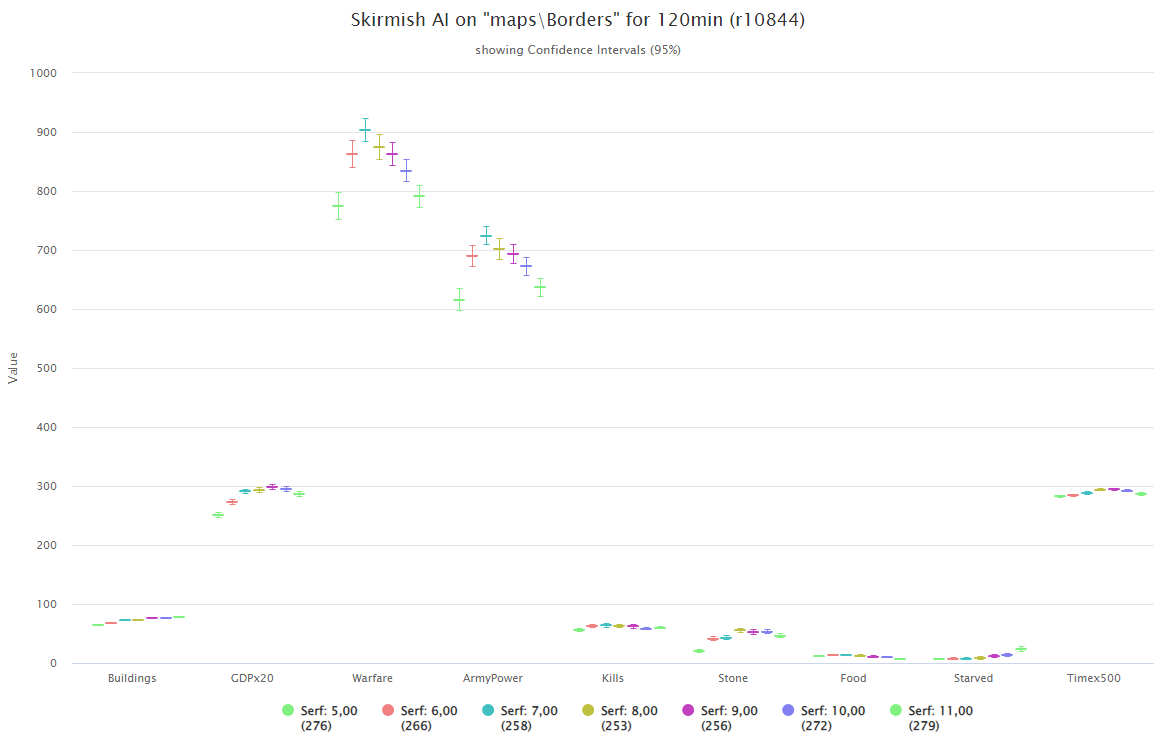
These charts show the result of 1400 and 470 runs between 4 skirmish AIs on a couple of skirmish maps for 120 minutes. Displayed groups are - Houses built by AI, Total produced wares value (GDP), produced warfare value, Army size in units, Enemy kills, Stone reserve, Food reserve, Number of units starved to death and Run times. Sections are for serfs per 10 houses (5 - 11). I’ll let you draw conclusions from that chart yourself :-)
Leave a comment
Log in with itch.io to leave a comment.